PING: Leak and Capacitance
Paired leak-conductance and membrane-capacitance sweeps in the frozen network used by exp123.
Abstract
We varied leak conductance and membrane capacitance separately from ×0.5 to ×2 in one frozen trained PING network, using 100 test images and ten paired encodings per image. Excitatory cycle participation rose from 19.4% to 28.7% under leak modulation and from 20.6% to 27.1% under capacitance modulation. Firing increased in both sweeps; spectral peaks changed nonmonotonically. These descriptive results concern one checkpoint, without uncertainty estimates or replication across independently trained networks.
Results
We applied paired interventions to the trained PING (pyramidal–interneuron gamma) circuit used in exp123, with checkpoint weights from exp022. Excitatory () and inhibitory () populations changed together within each sweep. The figures describe 37,000 presentations from one checkpoint: 100 test images, ten per digit, with ten paired encodings each. They do not establish variation across trained networks or classification performance.
The historical presentation exp134-r004-present was derived from
exp134-r002-analyse and exp134-r001-compute. It used SNNLab 0.18.0 and
100 images. The current recipe defaults to 500 images and the current SNNLab API;
those changes have not produced the displayed evidence.
Leak conductance
From ×0.5 to ×2, total E firing rose from 14,898 to 20,524 spikes/s, and cycle participation from 19.4% to 28.7%. Spectral peaks shifted from 58.9 to 64.7 Hz with local reversals; rhythm contrast decreased. Greater participation therefore did not imply greater rhythm contrast.
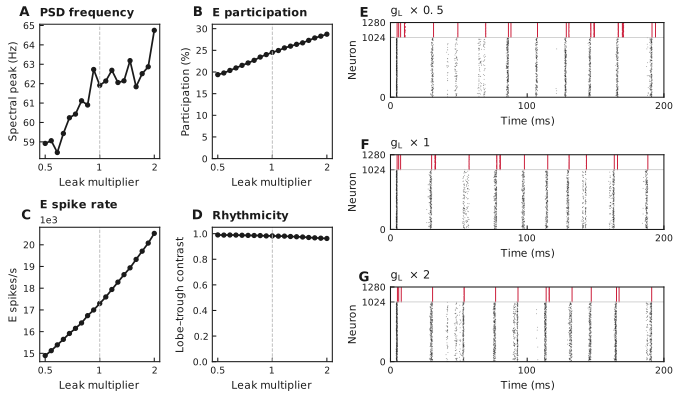
A–D show the excitatory spectral peak (Hz), accepted-cycle participation (%), total excitatory firing (spikes/s), and dimensionless rhythm contrast. The dashed line marks the shared ×1 baseline. E–G show diagnostic image 140 (digit 6), encoding identifier 42, at ×0.5, ×1 and ×2; excitatory spikes are black and inhibitory spikes red. All panels cover 0–200 ms; no uncertainty estimates are shown.
Membrane capacitance
Total E firing rose from 14,463 to 20,177 spikes/s, and participation from 20.6% to 27.1%. The endpoint spectral peaks were 58.5 and 67.1 Hz, with local reversals between them. Rhythm contrast increased overall.
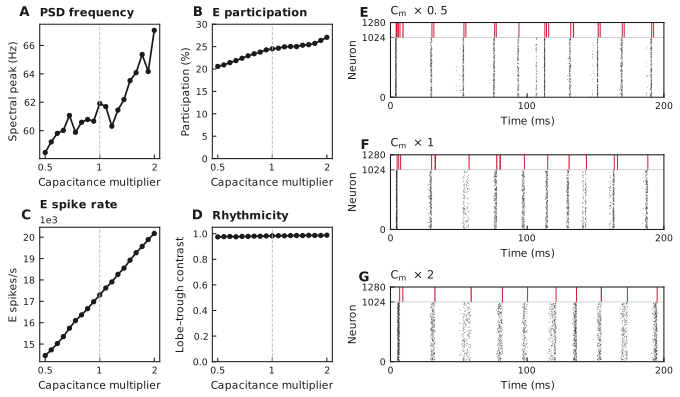
Panels and units match Figure 1. E–G use the same diagnostic image, encoding and colours at ×0.5, ×1 and ×2. Both sweeps reuse every input spike train and the same ×1 baseline. Participation includes accepted cycles only.
Methods
- Paired inputs and frozen weights. We sampled ten images per digit without replacement from exp123’s balanced 500-image official MNIST test bank, using selection seed 134. Pixel intensities in [0, 1] scaled Poisson encoding rates up to 25 Hz. Encoding identifiers 42–51 used generator seeds , where is the original image index and the encoding identifier. Each 200 ms presentation started from fresh state at a 0.1 ms timestep. All conditions reused the encodings and final-epoch checkpoint weights.
- Separate membrane sweeps (Figures 1–2). The dimensionless multiplier , with setting index , scaled either leak conductances µS or capacitances nF. The other parameter stayed at its baseline. The passive time constant is in ms for population . Thus leak scaling gives ms, and capacitance scaling gives ms. Both sweeps share the ×1 baseline; inhibitory synaptic decay remains 6 ms. These are interventions in the conductance-based model, not evidence that passive time constants alone determine the response.
- Frequency and firing (panels A, C). We demeaned full-trial E population spike counts and computed a Hann-window Welch power spectral density (PSD) with one segment spanning the trial. The peak of the mean PSD in 5–150 Hz used parabolic interpolation. Total E spikes/s divides each trial’s total spike count by 0.2 s, then averages trials; it is not a per-neuron rate.
- Participation (panel B). We smoothed I population counts with a 1 ms Gaussian and detected volleys at least 2 ms apart, requiring prominence of at least one spike and 20% of the smoothed maximum. Midpoints bracketed complete interior cycles. A trial required at least one cycle and mean I participation of at least 50%. E participation is the fraction of E neurons spiking at least once per accepted cycle, averaged over cycles, accepted draws within each image, then eligible images. Every condition accepted all 1,000 trials and all 100 images; rejected trials would be excluded, not zero-filled.
- Rhythm contrast and diagnostics (panels D–G). SNNLab’s normalized autocorrelogram used 1 ms bins and lags up to 100 ms. Contrast is , where is the smoothed central-lobe height before the first trough and that trough’s height. We averaged finite trial contrasts. Rasters show one diagnostic image and encoding, not an independent evaluation.
Network diagrams
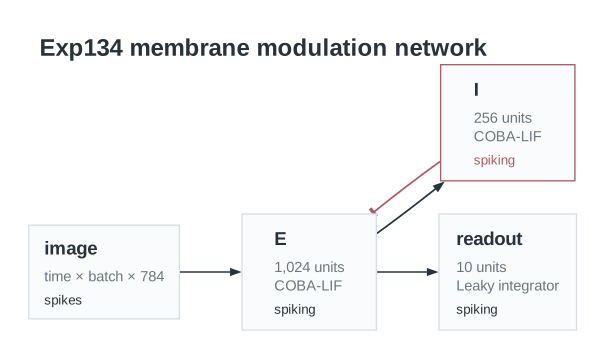
Native circuit view from the selected compute bundle. Both sweeps share this topology and frozen checkpoint weights; only E/I membrane parameters vary.
Parameters
| Parameter | Recorded value |
|---|---|
| Network | |
| Input channels | 784 |
| E / I neurons | 1024 / 256 |
| E / I membrane model | coba_lif / coba_lif |
| Same-population recurrence | Absent |
| Neurons | |
| Baseline capacitance, E / I | 1 / 0.5 nF |
| Baseline leak conductance, E / I | 0.05 / 0.1 µS |
| Baseline passive time constant, E / I (derived) | 20 / 5 ms |
| Leak-sweep conductance range, E / I | 0.025–0.1 / 0.05–0.2 µS |
| Capacitance-sweep range, E / I | 0.5–2 / 0.25–1 nF |
| Resting potential, E / I | -65 / -65 mV |
| Reset potential, E / I | -65 / -65 mV |
| Threshold, E / I | -50 / -50 mV |
| Initial voltage, E / I | -65 / -65 mV |
| Refractory period, E / I | 1.2 / 0.6 ms |
| Refractory timing | following_steps |
| Voltage sampling | explicit |
| Voltage-gradient damping, E / I | 1000 / 1000 |
| Synapses and weights | |
| E→I synapse / decay | ampa / 2 ms |
| E→I delay | 0.1 ms |
| E→I saved matrix shape | 1024 × 256 |
| I→E synapse / decay | gaba / 6 ms |
| I→E delay | 0.1 ms |
| I→E saved matrix shape | 256 × 1024 |
| Input→E synapse / decay | ampa / 2 ms |
| Input→E delay | 0 ms |
| Input→E saved matrix shape | 784 × 1024 |
| E→Output synapse / decay | leaky_integrator / 2 ms |
| E→Output delay | 0 ms |
| E→Output saved matrix shape | 1024 × 10 |
| Weights | All restored from the identified final-epoch checkpoint and frozen |
| Checkpoint SHA-256 | 34a94d90e652059ef754a214670d2fe642af504a6fcc01380d33bd22854278c6 |
| Native parameter payload SHA-256 (baseline) | ce1d105793194681e2a2f797263345f70d06de7dc9d639a2bee16c1316e1211e |
| Input and simulation | |
| Partition | official_mnist_test |
| Image selection | ten per digit without replacement from exp123's balanced 500-image bank |
| Images / selection seed | 100 / 134 |
| Encoding | Pixel-scaled Poisson spikes, discretized as Bernoulli events |
| Maximum pixel rate | 25 Hz |
| Encoding identifiers | 42, 43, 44, 45, 46, 47, 48, 49, 50, 51 |
| Generator seed rule | 1000 * image_index + draw identifier |
| Timestep / duration / burn-in | 0.1 / 200 / 0 ms |
| Image batch size | 5 |
| Conditions / presentations | 37 / 37000 |
| Build seed | 0 |
| SNNLab version | 0.18.0 |
| Readout | |
| Output neurons | 10 |
| Output model | leaky_integrator |
| Output time constant | 2 ms |
| Output soft-reset threshold (dimensionless) | 1 |
| Output initial voltage (dimensionless) | 0 |
| Output surrogate slope | 1 |
| Classification evaluation | Not performed in this experiment |
| Analysis | |
| Population bin width | 1 ms |
| Frequency search | 5–150 Hz |
| Volley smoothing / minimum spacing | 1 / 2 ms |
| Volley prominence, relative / absolute | 0.2 / 1 spikes |
| Minimum cycles / mean I participation | 1 / 50% |
| Aggregation | peak of mean full-trial E PSD; mean E spikes/s and finite rhythm contrast across draws/images; participation averages accepted draws within image then eligible images |
| Uncertainty estimates | None |
Native start snapshots follow the selected presentation’s compute ancestry; input settings come from its recorded configuration and analysis settings from its retained measurements. Paired values follow E / I order. Baseline passive time constants are capacitance divided by leak conductance. Matrix shapes use source × target order from the saved parameter payload, not graph initializer shapes. Zero-valued graph initializers are placeholders replaced by checkpoint weights before snapshot capture. Missing evidence is unavailable; current recipe defaults are never substituted. No training is performed in this experiment.
Dataset
Upstream: exp022 — MNIST, exp123 — Decision Time and Gamma Cycles
Downstream: —
| Run | Date | Duration | Size | Evidence | Storage | Ran on | Verification |
|---|---|---|---|---|---|---|---|
| exp134-r004-present | 2s | 1.3 MB | Current | R2 | Local | Local: absent; R2: catalog-verified | |
| exp134-r002-analyse | 7m 22s | 658.9 KB | Current | R2 | Local | Local: absent; R2: catalog-verified | |
| exp134-r001-compute | 20m 31s | 732.4 MB | Current | R2 | Local | Local: absent; R2: catalog-verified | |
| exp123-r068-compute | 1h 16m 39s | 961.4 MB | Current | R2 | Local | Local: absent; R2: catalog-verified | |
| exp022-r001-compute | 2d 7h 4m 16s | 2 GB | Current | R2 | HPC | Local: absent; R2: catalog-verified |