Scikit-learn Digits
Two spiking digit classifiers, with and without inhibitory feedback.
Abstract
We compare two spiking networks on small handwritten digits. Both use conductance-based leaky integrate-and-fire neurons and choose a digit by counting spikes from ten output neurons. The PING model adds a fixed inhibitory feedback loop to the feed-forward COBA model. Both use the same training, validation and test partitions, one random seed and classification loss without spike penalties. With 200 ms presentations and 30 epochs, validation-selected COBA and PING checkpoints reached 80.6% and 71.7% held-out test accuracy, respectively. Adding feedback did not improve classification in this run; variation across training seeds was not tested.
Results
Recipe v9 ran locally on CPU with SNNLab 0.23.0 and autocast disabled. The dataset contained 1437 training, 180 validation and 180 held-out test images. Each model trained for 30 epochs; minimum validation cross-entropy selected one checkpoint for a single held-out test evaluation. The rasters replay one training image through those selected checkpoints.
COBA training curves
After 30 epochs, online training accuracy was 84.8% and validation accuracy was 87.2%. Best validation accuracy was 88.3%. Validation cross-entropy changed from 2.312 to 0.426. The checkpoint selected by minimum validation loss was epoch 15; its held-out test accuracy was 80.6% on 180 images. The black curve shows online pre-update minibatch metrics; the red curve uses fixed epoch-end weights. Epoch zero shows untrained validation only. Crosses mark the selected-checkpoint test measurements.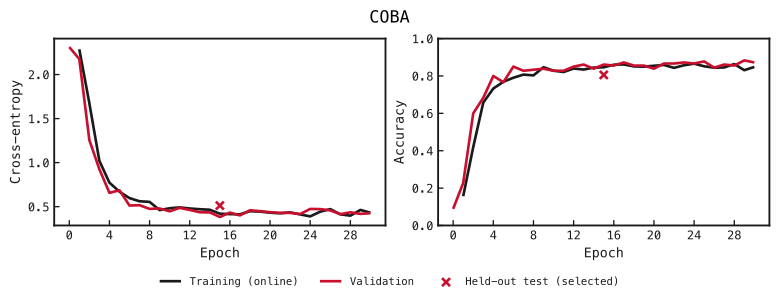
COBA classification loss (left) and accuracy (right). Black denotes training; red denotes validation. Crosses show the held-out test at the selected epoch. Accuracy is shown as a fraction.
PING training curves
After 30 epochs, online training accuracy was 75.5% and validation accuracy was 77.8%. Best validation accuracy was 82.2%. Validation cross-entropy changed from 2.309 to 0.679. The checkpoint selected by minimum validation loss was epoch 13; its held-out test accuracy was 71.7% on 180 images. The black curve shows online pre-update minibatch metrics; the red curve uses fixed epoch-end weights. Epoch zero shows untrained validation only. Crosses mark the selected-checkpoint test measurements.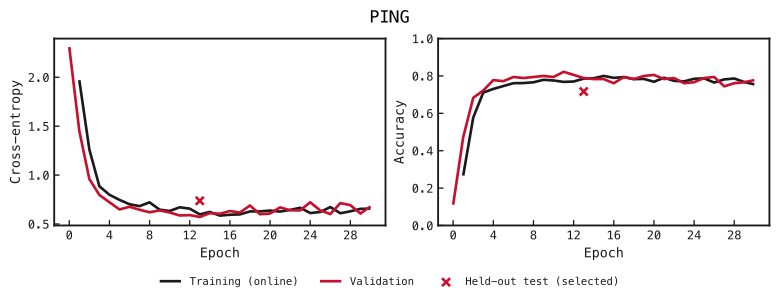
The same measurements for PING, with a fixed excitatory–inhibitory feedback loop. Crosses mark the held-out test measurements at the selected epoch.
COBA raster
Original sample 0 is digit 0; the validation-selected model (epoch 15) predicted 0. This image belongs to the train partition. It is a single-example diagnostic, not an independent test result.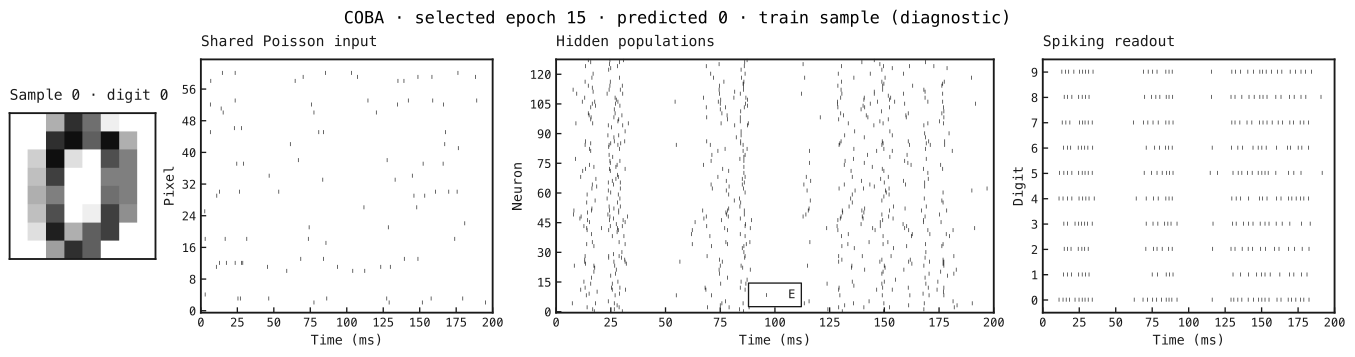
From left: the original 8 × 8 image, its Poisson input spikes, all hidden excitatory spikes, and readout spikes indexed by digit. Each tick is one spike; time is in milliseconds. The output neuron with the largest count selects the digit; ties select the lowest digit index.
PING raster
Original sample 0 is digit 0; the validation-selected model (epoch 13) predicted 0. This image belongs to the train partition. It is a single-example diagnostic, not an independent test result.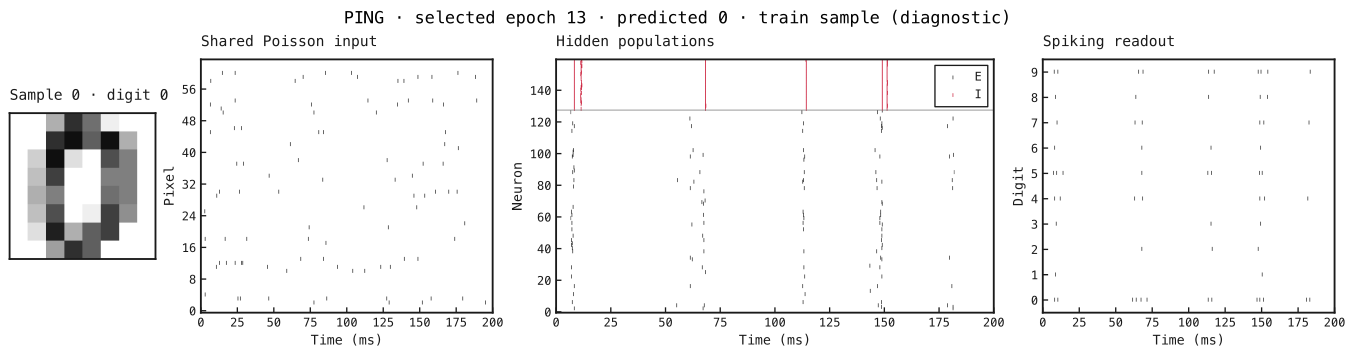
The same image and exact input spikes as Figure 3, replayed through PING’s validation-selected weights from fresh membrane state. Hidden excitatory neurons are black; inhibitory neurons are red and placed above them. The readout uses black ticks.
Network diagrams
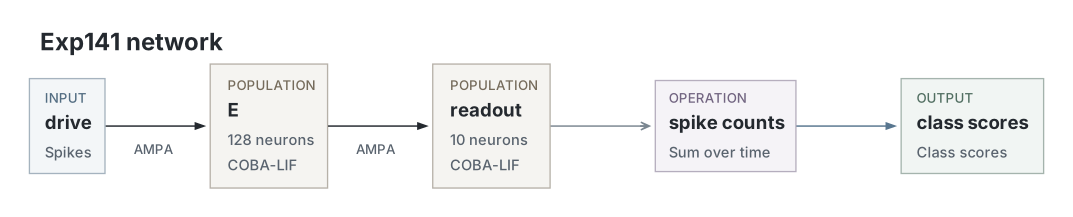
COBA circuit generated from the executed SNNLab bundle. The input and readout projections are learned; all neurons are conductance-based leaky integrate-and-fire.
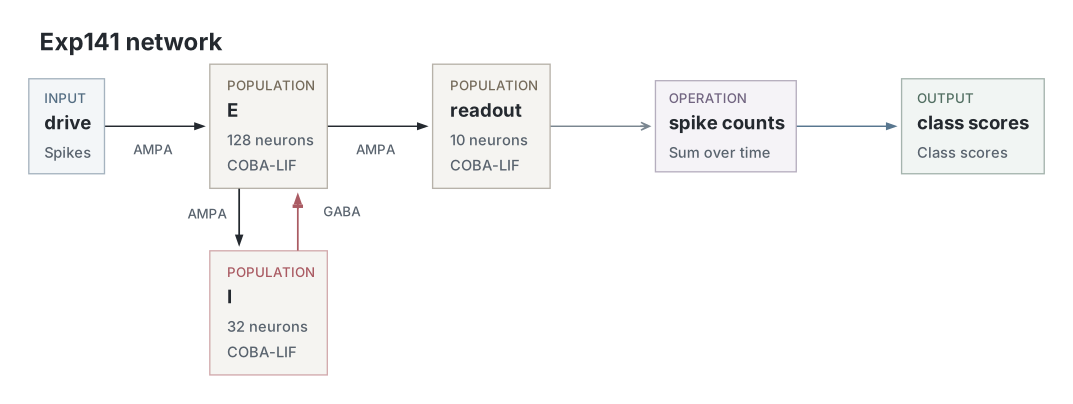
PING adds excitatory input to inhibitory neurons and inhibitory feedback to the hidden excitatory population. Both feedback matrices remain fixed.
Parameters
| Parameter | COBA | PING |
|---|---|---|
| Network | ||
| Population size, E / I | 128 / — | 128 / 32 |
| Membrane model, E / I | coba_lif / — | coba_lif / coba_lif |
| Input channels | 64 | 64 |
| Neurons | ||
| Membrane capacitance, E / I | 1 / — nF | 1 / 0.5 nF |
| Leak conductance, E / I | 0.05 / — µS | 0.05 / 0.1 µS |
| Passive time constant (derived), E / I | 20 / — ms | 20 / 5 ms |
| Resting potential, E / I | -65 / — mV | -65 / -65 mV |
| Reset potential, E / I | -65 / — mV | -65 / -65 mV |
| Spike threshold, E / I | -50 / — mV | -50 / -50 mV |
| Refractory period, E / I | 1.2 / — ms | 1.2 / 0.6 ms |
| Synapses and weights | ||
| Input→E synapse / decay (ms) | ampa / 2 | ampa / 2 |
| Input→E delay (ms) | 0 | 0 |
| Input→E matrix shape | 64 × 128 | 64 × 128 |
| Input→E initial per-connection mean / SD (µS) | 0.0140625 / 0.00140625; clamped nonnegative | 0.0140625 / 0.00140625; clamped nonnegative |
| Input→E weights | learned | learned |
| E→Output synapse / decay (ms) | ampa / 2 | ampa / 2 |
| E→Output delay (ms) | 0 | 0 |
| E→Output matrix shape | 128 × 10 | 128 × 10 |
| E→Output initial per-connection mean / SD (µS) | 0.0078125 / 0.00078125; clamped nonnegative | 0.0078125 / 0.00078125; clamped nonnegative |
| E→Output weights | learned | learned |
| E→I synapse / decay (ms) | Not applicable | ampa / 2 |
| E→I delay (ms) | Not applicable | 0.2 |
| E→I matrix shape | Not applicable | 128 × 32 |
| E→I initial per-connection mean / SD (µS) | Not applicable | 0.0078125 / 0.00078125; clamped nonnegative |
| E→I weights | Not applicable | fixed |
| I→E synapse / decay (ms) | Not applicable | gaba / 6 |
| I→E delay (ms) | Not applicable | 0.2 |
| I→E matrix shape | Not applicable | 32 × 128 |
| I→E initial per-connection mean / SD (µS) | Not applicable | 0.0625 / 0.00625; clamped nonnegative |
| I→E weights | Not applicable | fixed |
| Input and simulation | ||
| Network / training seed | 42 | 42 |
| Timestep (ms) | 0.2 | 0.2 |
| Presentation (ms) | 200 | 200 |
| Input encoding | Pixel-scaled Poisson spikes, discretized as Bernoulli events | Pixel-scaled Poisson spikes, discretized as Bernoulli events |
| Pixel normalization | Intensity divided by 16 | Intensity divided by 16 |
| Maximum pixel rate (Hz) | 25 | 25 |
| Diagnostic encoding seed | 0 | 0 |
| Readout | ||
| Output neurons | 10 | 10 |
| Output membrane model | coba_lif | coba_lif |
| Output capacitance (nF) | 1 | 1 |
| Output leak (µS) | 0.05 | 0.05 |
| Output passive time constant (ms; derived) | 20 | 20 |
| Output rest / reset / threshold (mV) | -65 / -65 / -50 | -65 / -65 / -50 |
| Output refractory period (ms) | 1.2 | 1.2 |
| Class score | Output spike count over the full presentation | Output spike count over the full presentation |
| Decision / ties | Largest spike count / lowest digit index | Largest spike count / lowest digit index |
| Training | ||
| Epochs | 30 | 30 |
| Batch size | 32 | 32 |
| Optimizer | adamw | adamw |
| Learning rate | 0.0004 | 0.0004 |
| Weight decay | 0 | 0 |
| Gradient clipping | 1 | 1 |
| Surrogate | fast_sigmoid; slope 1 | fast_sigmoid; slope 1 |
| Regularizers | None | None |
| Voltage-gradient damping, E / I | 1000 / — | 1000 / 1000 |
| Output voltage gradient dampening | 1000 | 1000 |
| Analysis | ||
| Dataset | sklearn.datasets.load_digits | sklearn.datasets.load_digits |
| Training / validation / test examples | 1437 / 180 / 180 | 1437 / 180 / 180 |
| Loss / accuracy | Cross-entropy / fraction correct | Cross-entropy / fraction correct |
| Training curve measurement | Online pre-update minibatch metrics | Online pre-update minibatch metrics |
| Validation measurement | Fixed epoch-end weights | Fixed epoch-end weights |
| Test / raster checkpoint | Minimum validation cross-entropy | Minimum validation cross-entropy |
| Selected epoch | 15 | 13 |
| Test measurement | One fixed-weight evaluation on the held-out test partition | One fixed-weight evaluation on the held-out test partition |
| Raster counting window (ms) | 0–200 | 0–200 |
| Diagnostic sample | Original index 0; digit 0; train partition | Original index 0; digit 0; train partition |
| Training seeds reported | 1 | 1 |
Model, training and analysis settings. Neural and training parameters come from native best-validation start snapshots and final-training end snapshots reached through the selected presentation; input and analysis settings describe that same run. E and I denote excitatory and inhibitory hidden neurons. Paired values follow E / I order; an em dash marks an absent population. The output has one neuron per digit. Initial weight means and standard deviations (SD) are per-connection parent-distribution values after fan-in scaling, with negative draws clamped to zero. Initializer statistics describe initial draws, not the final learned distribution. Passive time constants are derived as capacitance divided by leak conductance. Matrix shapes list source × target units. Test scores and diagnostic rasters use the validation-selected weights; model settings and matrix shapes above use those same selected-weight snapshots. Optimizer and training settings use the final-training snapshots.
Dataset
Upstream: —
Downstream: —
| Run | Date | Duration | Size | Evidence | Storage | Ran on | Verification |
|---|---|---|---|---|---|---|---|
| exp141-r014-present | 1s | 945.3 KB | Current | R2 | Local | Local: absent; R2: catalog-verified | |
| exp141-r013-analyse | <1s | 582.1 KB | Current | R2 | Local | Local: absent; R2: catalog-verified | |
| exp141-r012-compute | 21m 9s | 907.4 KB | Current | R2 | Local | Local: absent; R2: catalog-verified |