Theta nested Gamma
A 5 Hz afferent-rate envelope compared with constant excitation of the same mean.
Abstract
Independent excitatory afferents drive a recurrent excitatory–inhibitory circuit. We compare a 5 Hz sinusoidal rate envelope ranging from 0.2 to 3.8 Hz per afferent with constant 2 Hz input. The connectivity, weights and initial state are paired across conditions. Over 200–800 ms, mean E firing was 16.76 versus 15.82 Hz, and amplitude-weighted phase concentration was 0.526 versus 0.077. This single-seed comparison does not establish an independent gamma oscillator.
Question
Does a theta-frequency envelope on otherwise independent afferent excitation organise fast population bursting? We extend the circuit in Susin and Destexhe (2021) with periodic input and a constant-input comparison. The circuit is a modified conductance-based LIF version of the published PING network.[1]
Both populations receive excitatory afferents. From the start of the simulation, with no burn-in, the theta condition follows
Here is time in seconds from initialization, is the rate of each afferent in spikes/s, spikes/s is the mean, spikes/s is the modulation amplitude, and Hz is the envelope frequency. The rate ranges from 0.2 to 3.8 Hz and starts at its rising mean crossing. The comparison remains at 2 Hz. The two conditions therefore have the same prescribed mean over complete cycles; their realised spike counts and neuronal firing rates need not match.
Results
Recorded activity
Loading recorded circuit…
Paired comparison
We measured activity from 0.2 to 0.8 seconds, spanning three complete theta cycles and excluding 200 ms at each end from measurement. The full simulation, including the initial transient, is shown; no burn-in was simulated. Mean E firing rates were 16.76 Hz with theta input and 15.82 Hz with constant input; mean I rates were 19.67 and 18.29 Hz, respectively.
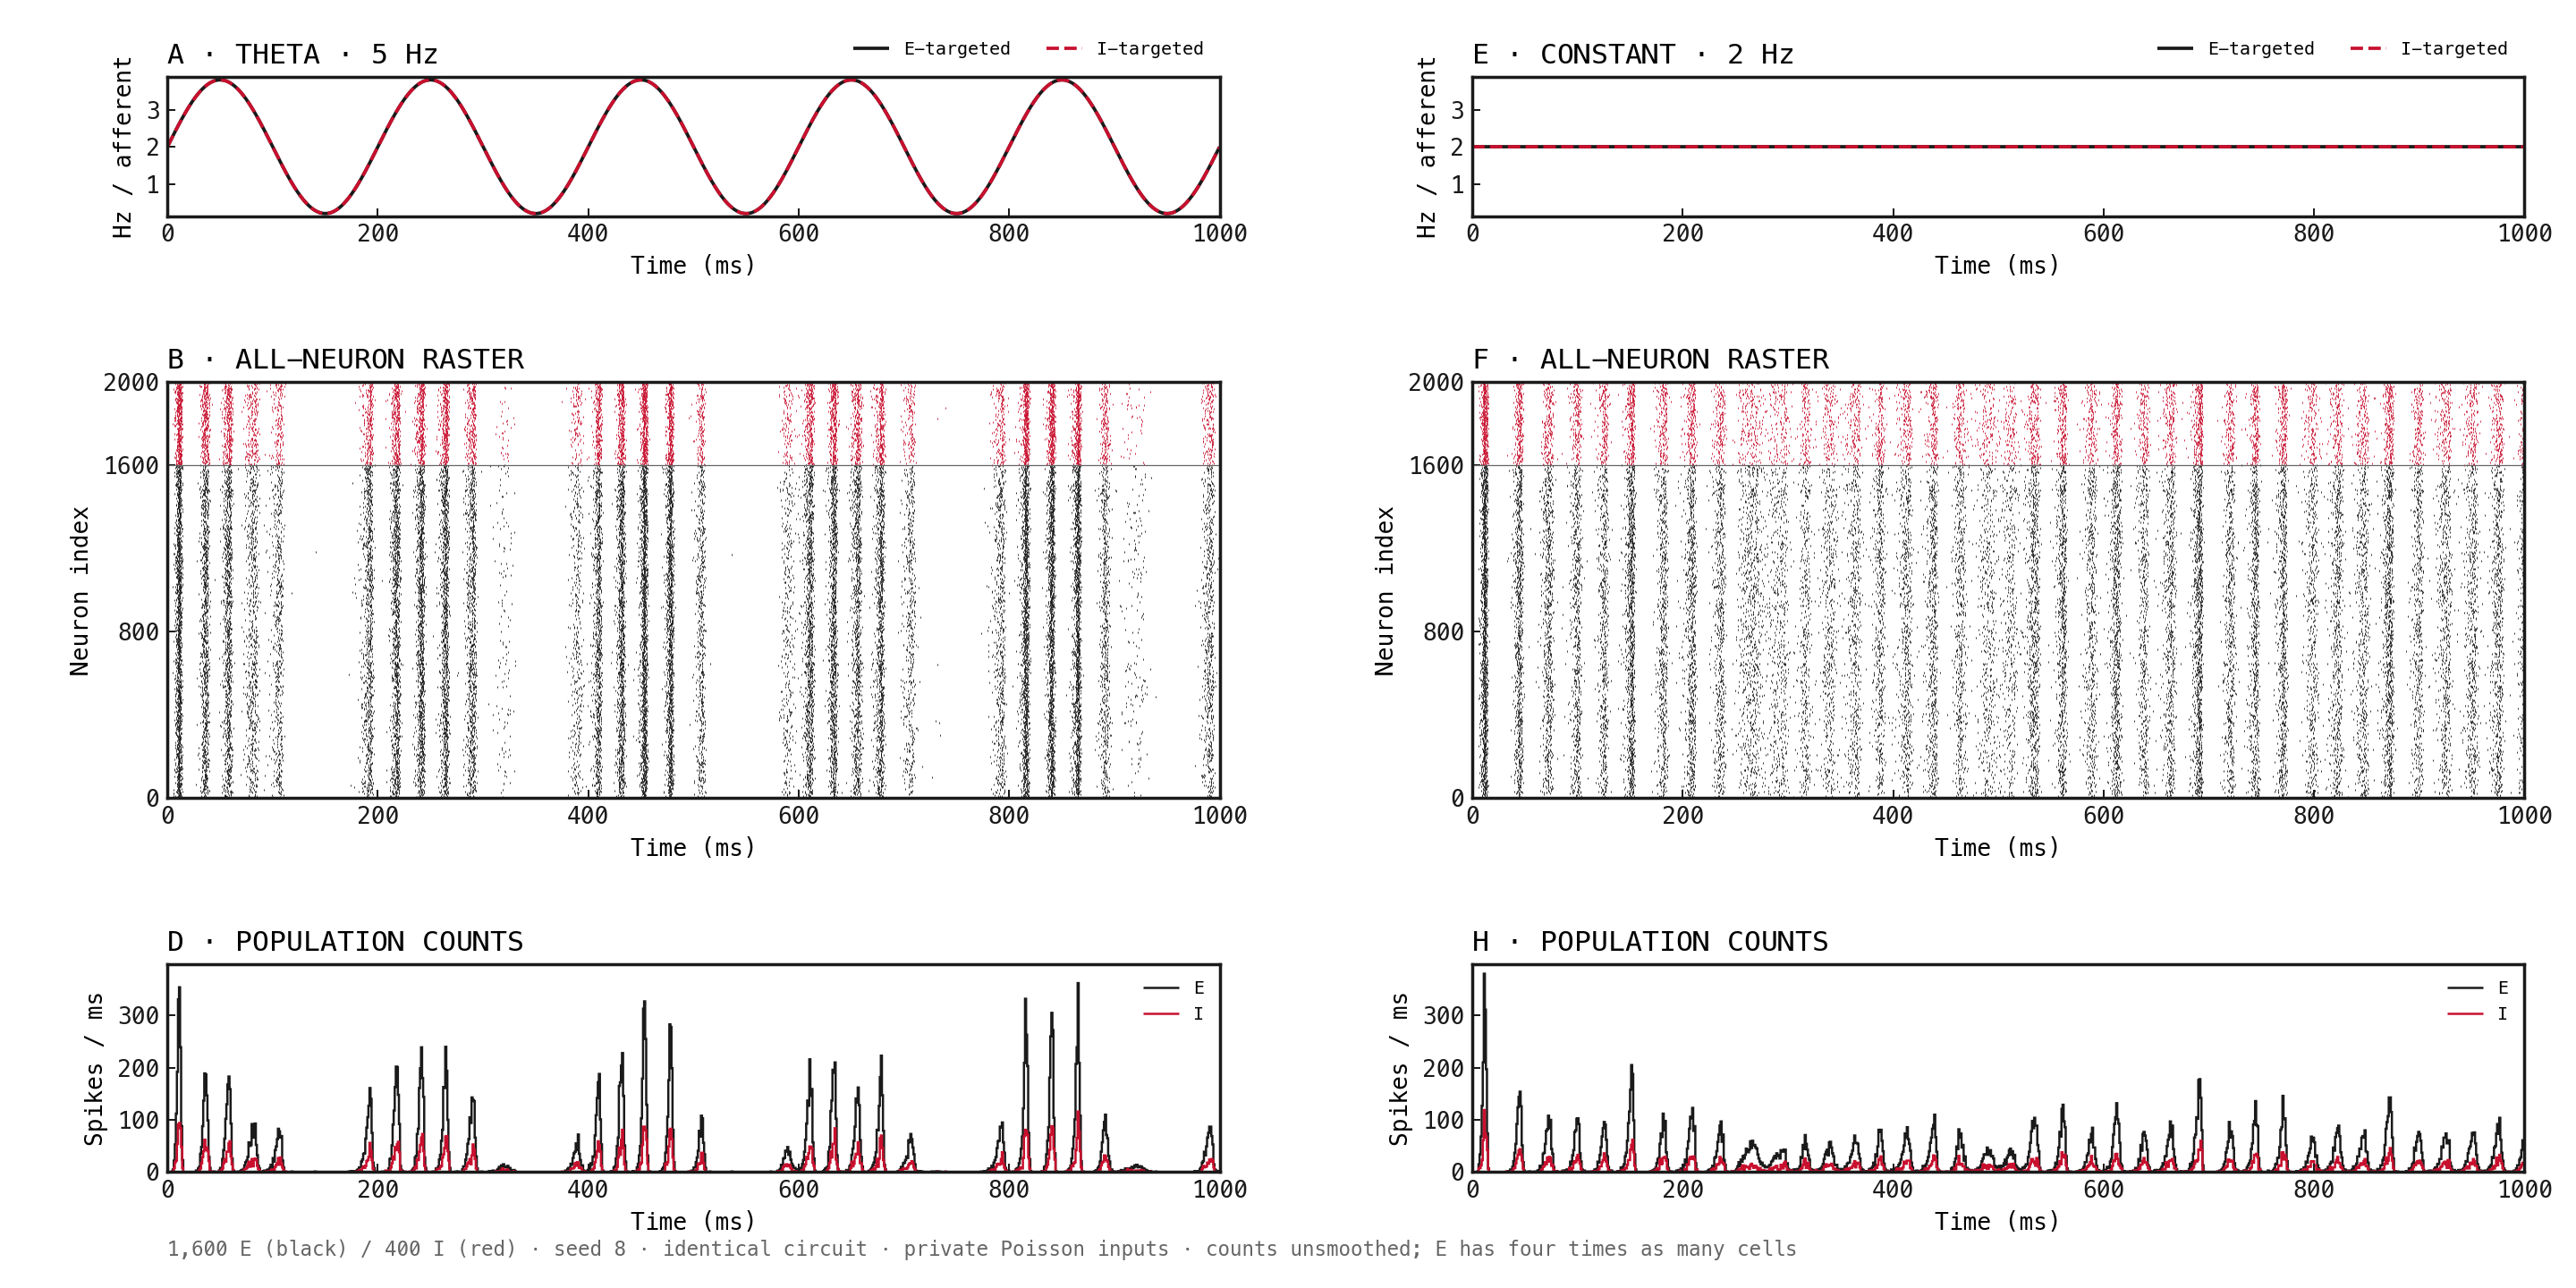
Figure 3: Fresh simulations with theta-modulated input on the left and constant input on the right. A/E: prescribed per-afferent rates, black solid for E-targeted and red dashed for I-targeted inputs; the two traces coincide. B/F: all 1,600 E neurons in black below 400 I neurons in red over 5 theta periods. D/H: unsmoothed population spike counts in 1 ms bins. Every panel spans the full 0–1,000 ms recording. E contains four times as many cells as I. Axes share scales across conditions. Time starts at initialization with no burn-in; both conditions use seed 8.
| Measurement | Theta input | Constant input |
|---|---|---|
| E spectral peak within 30–90 Hz | 44 Hz | 40 Hz |
| I spectral peak within 30–90 Hz | 44 Hz | 40 Hz |
| E amplitude-weighted phase concentration | 0.526 | 0.077 |
| I amplitude-weighted phase concentration | 0.527 | 0.079 |
Descriptive measurements from one paired seed. Spectral peaks are raw frequency-bin maxima in the specified search interval, with 2 Hz bin spacing. Phase concentration measures how strongly the 30–90 Hz amplitude envelope is concentrated at the prescribed theta phase; the same reference clock is assigned to the constant condition. Values range from zero to one. No significance test or surrogate correction was applied.
These observations characterise this circuit under the specified input envelopes. They do not establish a separate gamma oscillator: sharp theta-locked bursts can contribute harmonics to the filtered band, and a maximum at a search boundary is not evidence of an isolated spectral peak. Repeated seeds, spectral-background checks and feedback interventions would be needed for a stronger mechanistic claim.
Methods
- Pair the input conditions. Reuse connectivity, weights and the initial state; generate target-specific Poisson counts with the same random streams. Only the prescribed source-rate envelope differs. Parameters are listed in the appendix.
- Measure population rates and spectra. Count all spikes in 1 ms bins and divide by population size and bin duration. Use 200–800 ms for rate and spectrum summaries. Welch spectra use a Hann window, 500 ms segments and 50% overlap; report the raw maximum within 30–90 Hz, with 2 Hz bin spacing.
- Measure phase concentration. Apply a fourth-order Butterworth 30–90 Hz bandpass in second-order sections forward and backward over the full recording. Take the Hilbert-transform magnitude as the amplitude envelope, then crop to the measurement interval. Concentration is the magnitude of the amplitude-weighted mean unit phase vector at the prescribed 5 Hz phase. The constant condition uses the same clock. This is descriptive and has no surrogate correction.
Network diagrams
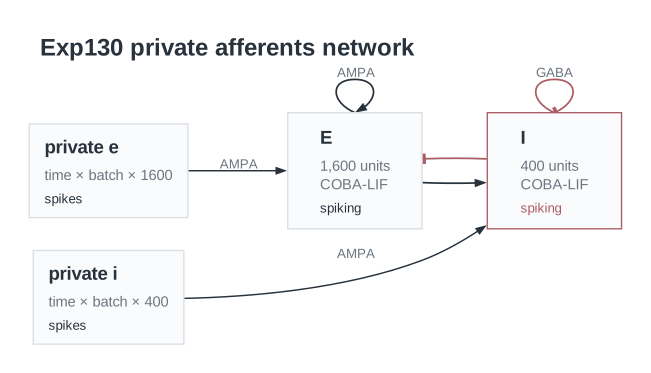
Figure A1: Shared circuit architecture for both conditions. Each E or I neuron receives its own aggregate excitatory input channel, representing 400 independent Poisson afferents. Recurrent excitation uses AMPA synapses and inhibition uses GABA synapses. Only the afferent-rate envelope differs between conditions; the connectivity and weights are identical. Loops on the E and I boxes represent connections between neurons within each population; individual neurons do not connect to themselves.
Parameters
| Parameter | Recorded value |
|---|---|
| Network | |
| Native parameter snapshot | Unavailable |
| Input channels | Unavailable |
| Populations | Unavailable |
| Membrane model | Unavailable |
| Neurons | |
| Membrane capacitance | Unavailable |
| Leak conductance | Unavailable |
| Resting potential | Unavailable |
| Reset potential | Unavailable |
| Threshold | Unavailable |
| Refractory period | Unavailable |
| Membrane time constant | Unavailable |
| Synapses and weights | |
| Native synapse and weight parameters | Unavailable |
| Input and simulation | |
| External afferents per neuron | 400 |
| Baseline E source rate | 2 Hz |
| Baseline I source rate | 2 Hz |
| Theta envelope frequency | 5 Hz |
| Envelope amplitude per afferent | 1.8 Hz |
| Analysis start | 200 ms |
| Analysis end | 800 ms |
| Seed | 8 |
| Timestep | 0.1 ms |
| Duration | 1000 ms |
| Burn-in | 0 ms |
| Analysis | |
| amplitude | fourth-order Butterworth 30–90 Hz SOS forward-backward filter; Hilbert magnitude; computed on full recording, then cropped away from endpoints |
| analysis interval ms | [200,800] |
| concentration | absolute amplitude-weighted mean phase vector; descriptive, no surrogate significance test |
| limitations | one paired seed; rate matching is prescribed input expectation, not realized count or output-rate matching; harmonics of theta-locked bursts can contribute to bandpassed amplitude; no independent gamma mechanism established |
| phase | prescribed 5 Hz sine phase, radians; same reference phase assigned to constant comparison |
| phase profile | mean gamma-band amplitude within 18 equal prescribed-phase bins |
| spectrum | Welch of 1 ms per-neuron population rates; Hann; 500 ms segments; 50% overlap; raw bin maximum in 30–90 Hz; 2 Hz bin spacing |
Dataset
Upstream: —
Downstream: —
| Run | Date | Duration | Size | Evidence | Storage | Ran on | Verification |
|---|---|---|---|---|---|---|---|
| exp130-r026-present | 1s | 6.3 MB | Current | R2 | Local | Local: absent; R2: catalog-verified | |
| exp130-r025-analyse | <1s | 431.4 KB | Current | R2 | Local | Local: absent; R2: catalog-verified | |
| exp130-r024-compute | 14s | 5.1 MB | Current | R2 | Local | Local: absent; R2: catalog-verified |
References
- Susin E, Destexhe A (2021). Integration, coincidence detection and resonance in networks of spiking neurons expressing Gamma oscillations and asynchronous states. PLOS Computational Biology, 17(9), e1009416.