Modulating Inhibitory Decay, Leak and Capacitance in PING networks
Paired-input sweeps of inhibitory decay, membrane leak and capacitance, measuring spectral frequency, excitatory participation, spike rate and rhythmic contrast.
Abstract
We varied inhibitory decay, membrane leak and capacitance separately in a frozen, trained PING network with paired encodings of one image. Longer decay broadly reduced spectral frequency and excitatory spike rate. Leak and capacitance modulation changed participation and spike rate, with smaller changes in spectral frequency. These internal interventions provide different modulation candidates; short recordings, harmonic ambiguity and limited sampling constrain their interpretation.
Results
Inhibitory decay sweep
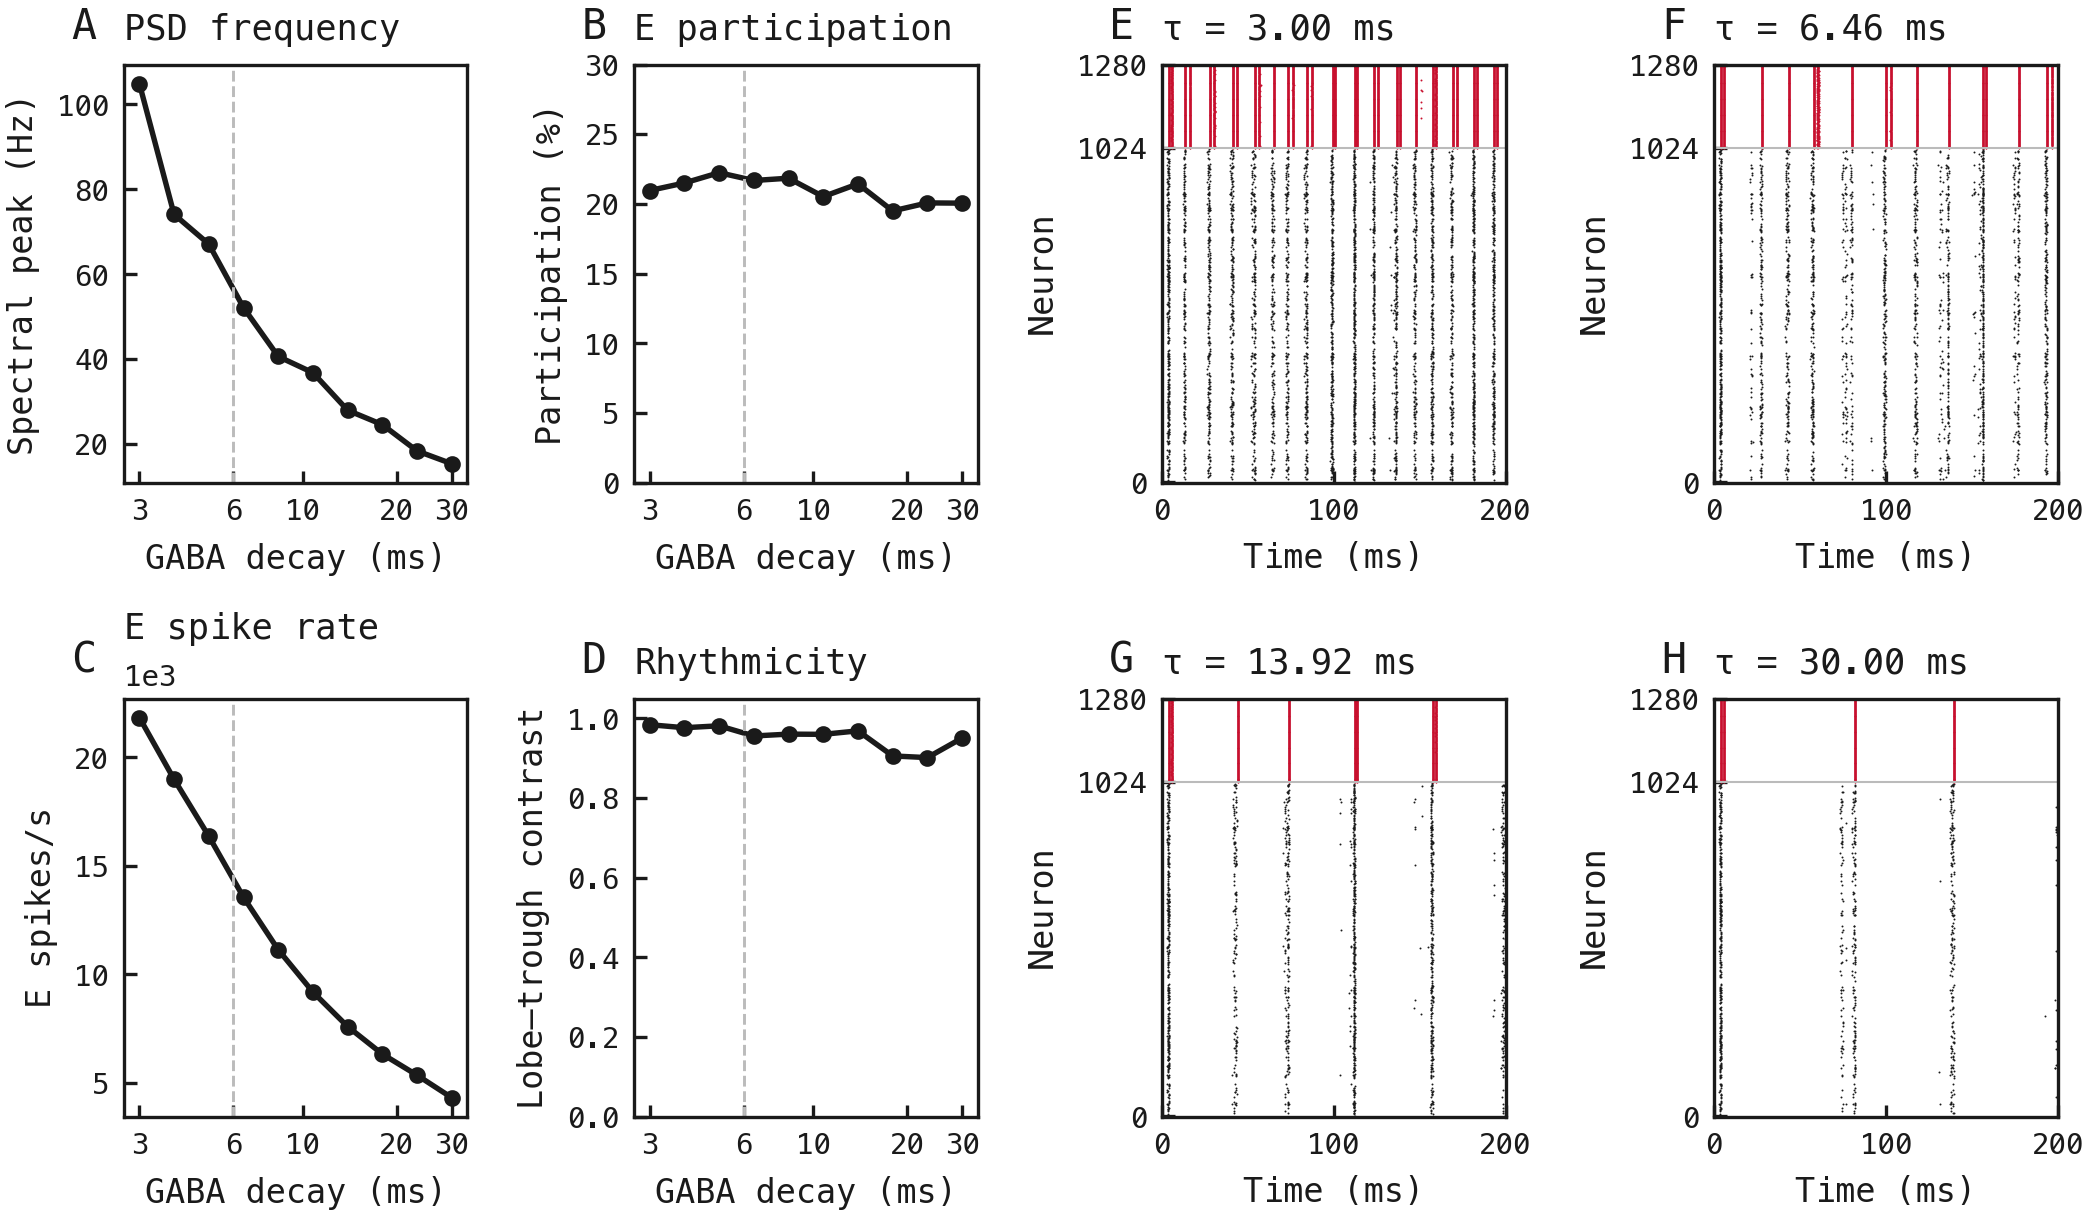
Left: metrics. (A) E-population PSD peak in a 5–150 Hz search. (B) Distinct E neurons per accepted complete cycle as a percentage of all E neurons. (C) Total E spikes per second. (D) E-autocorrelogram lobe–trough contrast. Black curves aggregate ten encoding draws and show the peak of their mean PSD in A and the mean draw-level measurements in B–D. Dashed lines mark the training decay constant. Right: rasters. (E–H) Decay constants of 3.00, 6.46, 13.92 and 30.00 ms, respectively; τ denotes inhibitory decay time. All 1,024 E neurons are black; 256 I neurons are red and plotted above E. Rasters use draw 42 and include boundary volleys; participation excludes partial edge cycles. New graph simulations use frozen trained weights, one MNIST test image and the full 200 ms without burn-in. No uncertainty intervals or independent training replicates are shown.
Membrane leak sweep
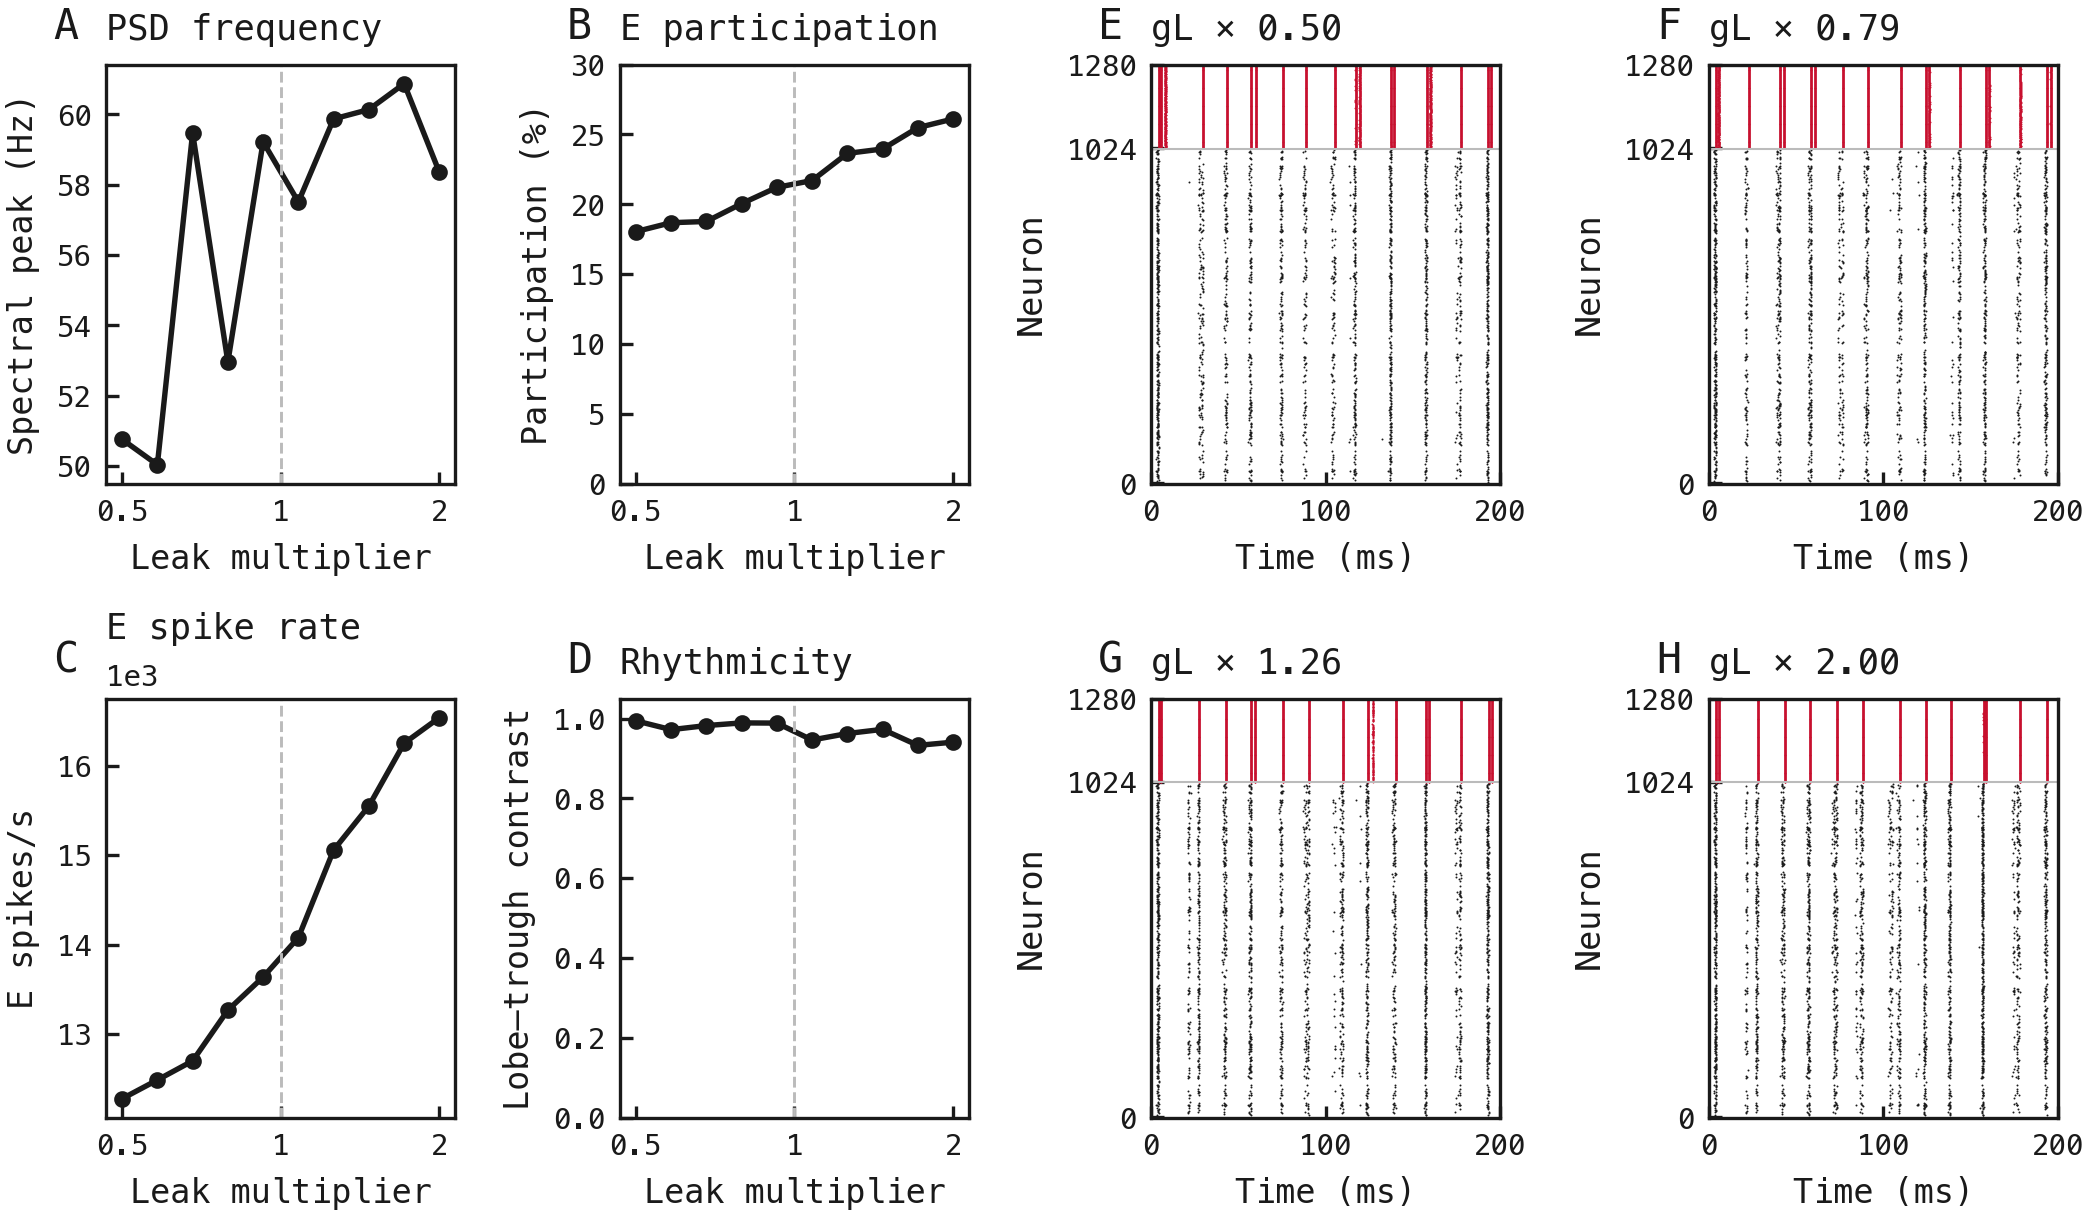
Leak sweep. Inhibitory decay is fixed at 6 ms. The leak multiplier scales E and I leak conductances together from defaults of 0.05 and 0.10 µS, respectively; capacitances remain fixed. (A–D) PSD frequency, E participation, total E spikes/s and lobe–trough contrast, using the estimators and line encodings of Figure 1. The dashed line marks default leak. Largest PSD peaks can select harmonics. (E–H) Rasters at leak multipliers 0.50, 0.79, 1.26 and 2.00, respectively; black E and red I neurons use encoding draw 42. Both sweeps reuse the same ten input spike trains and frozen weights. All 200 ms are retained, without burn-in; partial edge cycles are excluded from participation. No uncertainty intervals or independent training replicates are shown.
Membrane capacitance sweep
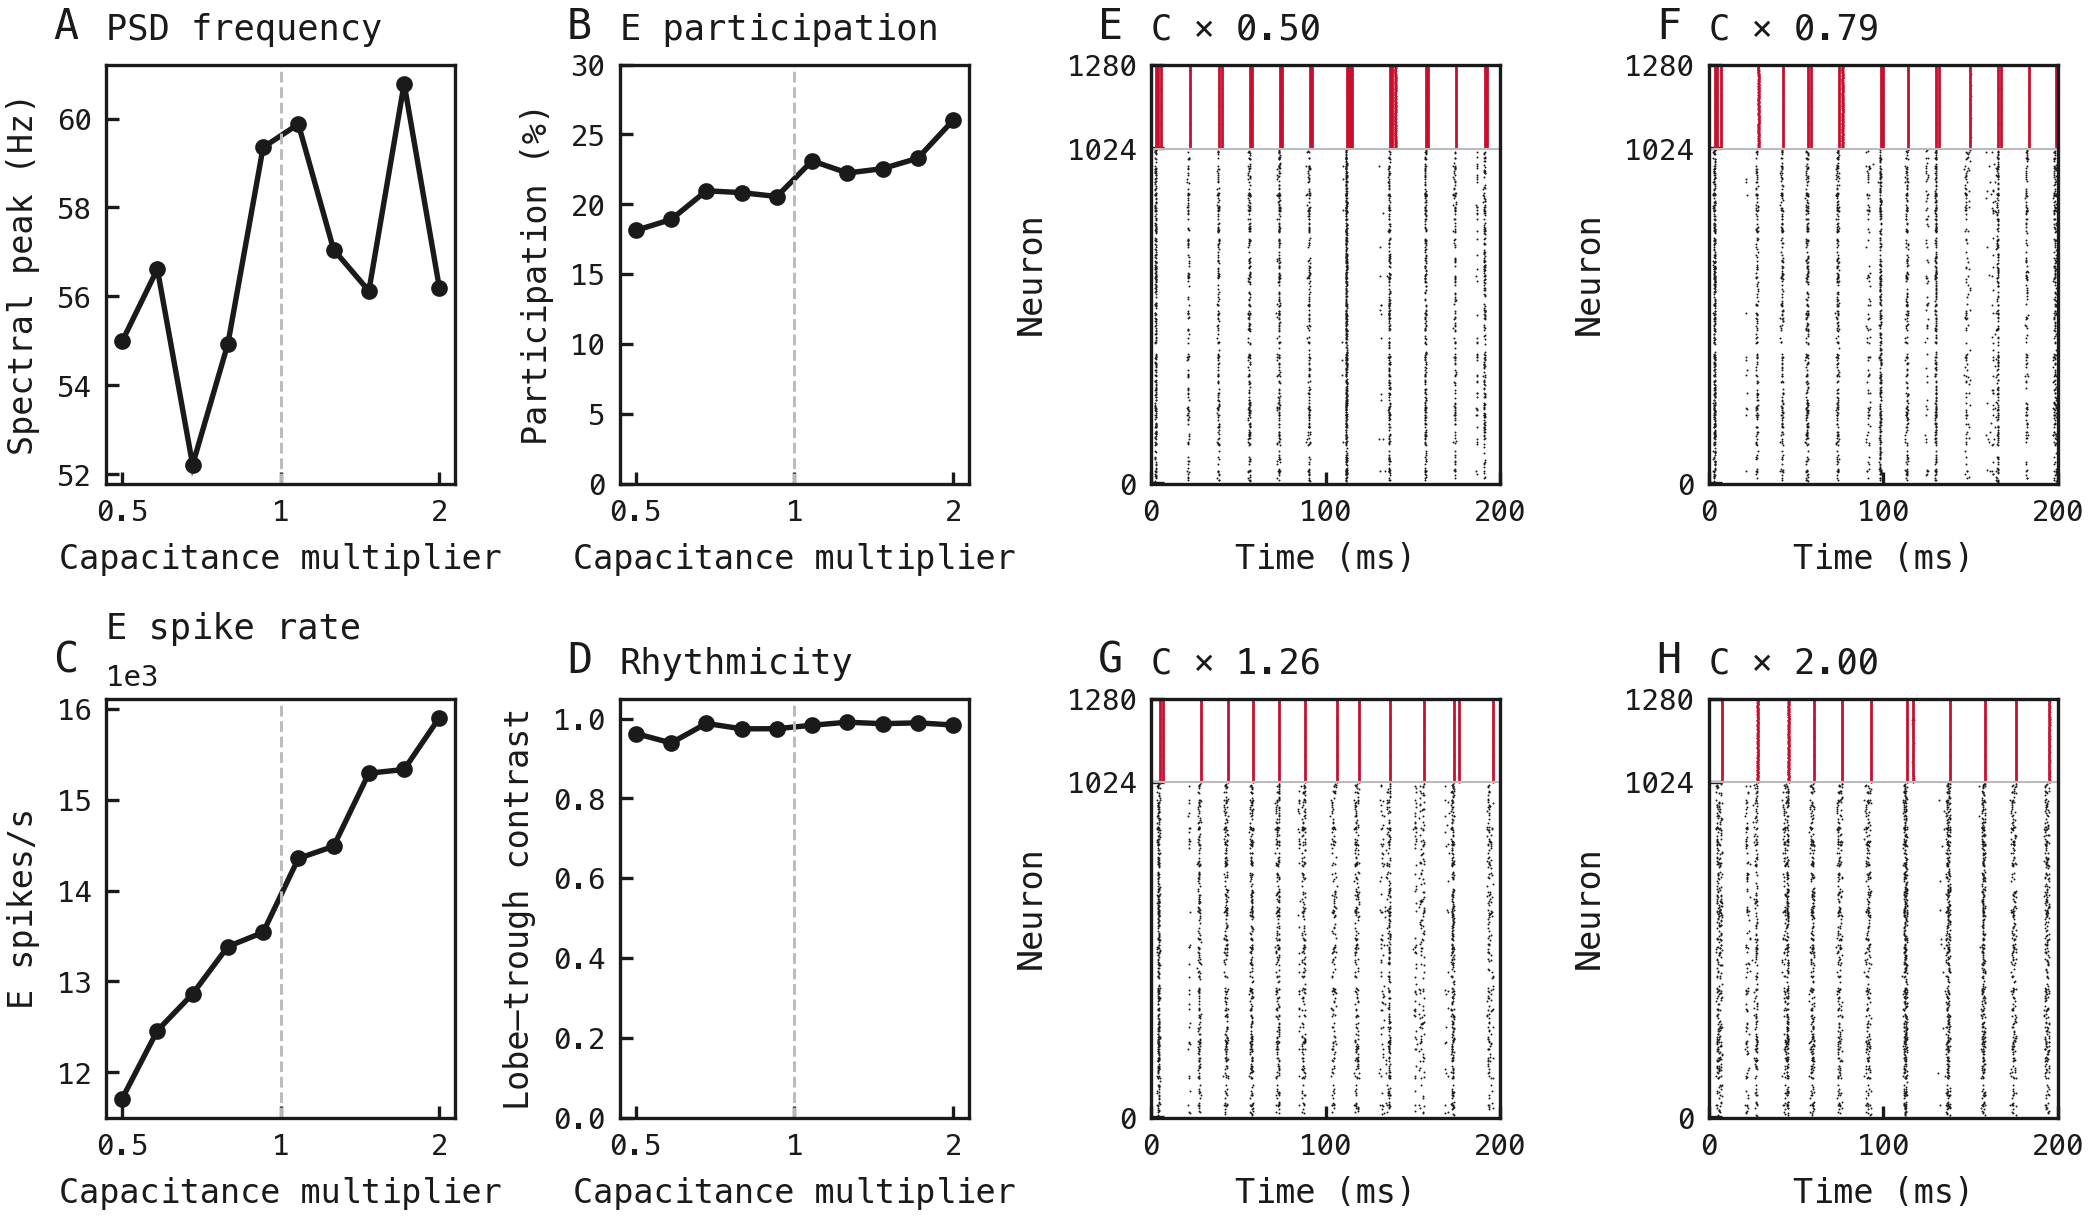
Capacitance sweep. Inhibitory decay is fixed at 6 ms and E/I leak conductances at 0.05/0.10 µS. The capacitance multiplier scales E and I capacitances together from defaults of 1.0 and 0.5 nF, respectively; membrane time constants follow capacitance divided by leak conductance. (A–D) PSD frequency, E participation, total E spikes/s and lobe–trough contrast, using the estimators and aggregate curves of Figure 1. The dashed line marks default capacitance. (E–H) Rasters at capacitance multipliers 0.50, 0.79, 1.26 and 2.00, respectively; black E and red I neurons use encoding draw 42. All three sweeps reuse ten input spike trains and frozen weights. All 200 ms are retained without burn-in; participation excludes partial edge cycles. No uncertainty intervals or independent training replicates are shown.
Methods
Network
Frozen final-epoch MNIST weights; 1,024 E and 256 I neurons, trained at 6 ms decay. Graph execution only; no retraining.
Inputs and sweep
First test image, digit seven; ten paired Poisson encodings at 25 Hz. Ten decay settings, 3–30 ms; 200 ms trials, 0.1 ms steps, no burn-in.
Leak sweep
Ten common E/I leak multipliers, ×0.5–2, at 6 ms decay. Fixed capacitances; identical weights and encoded inputs.
Capacitance sweep
Ten common E/I capacitance multipliers, ×0.5–2, at default leak and 6 ms decay. Identical weights and encoded inputs.
Frequency
Full-trial E-count SNNLab Welch PSD: Hann window, 5–150 Hz search, parabolic interpolation. Summary: peak of mean PSD; no harmonic rejection.
Participation
Distinct E neurons per complete I-volley cycle, divided by all E neurons. Midpoint boundaries exclude partial edge cycles; average equally across draws.
Spike rate
All E spikes divided by 0.2 s; exclude input, I and output spikes.
Rhythmicity
SNNLab rhythmicity estimator: E autocorrelogram lobe–trough contrast, 1 ms bins, 100 ms maximum lag; average across draws.
Dataset
Figures use the latest presentation run and their same-experiment inputs. The table includes completed run history; the presentation used by this report is emphasized. Dates are run creation times in UTC; durations cover each stage separately, and sizes cover its exported files. For imported runs, durations and execution locations refer to the recorded producing execution.
Upstream: exp022 — Training Runs
Downstream: —
| Run | Date | Duration | Size | Ran on |
|---|---|---|---|---|
| exp122-r040-present | 2s | 2.5 MB | Local | |
| exp122-r039-present | 2s | 2.5 MB | Local | |
| exp122-r038-analyse | 13s | 10.9 MB | Local | |
| exp122-r037-compute | 16s | 3 MB | Local |